Tue, 04 Jan 2011 23:05:13 GMT
Assuming the continuum hypothesis, there is a black-withe-coloring of the real plane  into two colors, such that on every line parallel to the x-axis, there are only countably many white points, andon every line parallel to the y-axis, there are only countably many black points. I have found this, including a proof, on Mathoverflow.
Well, something similar holds for the rational plane . In that case, there is a coloring such that on every line parallel to the x-axis we only have finitely many white points, and on every line parallel to the y-axis, we only have finitely many black points.
The proof is simple: We know there exists a bijection . Now color every point
  white if
  , and black otherwise. For every q there can only be finitely many p such that , and for every p there can only be finitely many q such that
  .
.
The interesting part about that is that this is a constructive result - it can actually be calculated - but still, it is highly counter-intuitive that such a coloring exists, and its rather difficult to find it when you do not know it already.
The awesomeness of Common Lisp gives a great opportunity to actually code it, using its included facilities of fractions:
(defun cantor-pair (n m)
(+ (* (+ n m) (+ n m 1) (/ 2)) m))
(defun z-to-n-0 (z)
(+ (* 2 (abs z)) (signum z)))
(defun rat-pair (q)
(cantor-pair (z-to-n-0 (numerator q)) (1+ (denominator q))))
(defun white-p (p q)
(< (rat-pair p) (rat-pair q)))
It uses Cantor's pairing function. I thought it'd be interesting to actually draw these points. Well, actually, it is not really interesting, anyway, here is the code that uses lispbuilder-sdl:
(sdl:with-init ()
(sdl:window 400 400)
(let ((zoom 100))
(flet ((draw-zoomed ()
(sdl:clear-display (sdl:color :r 0 :g 0 :b 0))
(dotimes (i 400)
(dotimes (j 400)
(when (white-p (/ i 400 zoom) (/ j 400 zoom))
(sdl:draw-pixel-* i j :color (sdl:color :r 255 :g 255 :b 255)))))
(sdl:update-display)))
(draw-zoomed)
(sdl:update-display)
(sdl:with-events ()
(:mouse-button-down-event
(:button btn)
(cond
((= btn sdl:mouse-wheel-up)
(incf zoom)
(draw-zoomed))
((= btn sdl:mouse-wheel-down)
(decf zoom)
(draw-zoomed))))
(:quit-event () t)))))
with the scroll-wheel you can change the interval that is shown (but be careful, if you scroll down 100 times, you get a division by zero, since the zoom will be 0 - as it was not that interesting I did not put that much effort into making it work). For everybody who does not want to do this, here is an image of some screenshot (I do not actually remember the zoom-factor):
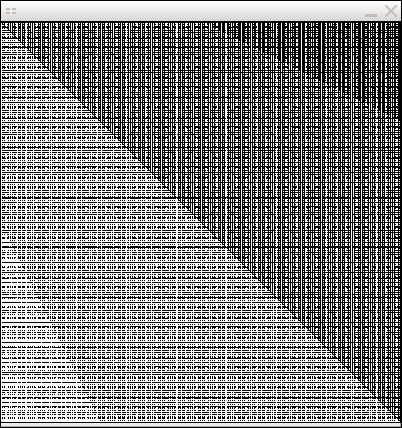
It looks sort of nice when you scroll through it. The stripes are probably some boundaries of denominators.
[PS: For some reason, at the time of publishing this post, MathJax does not render the set-symbols correctly. I will probably investigate on this later. It should be clear anyway.]
Well, something similar holds for the rational plane
The proof is simple: We know there exists a bijection
The interesting part about that is that this is a constructive result - it can actually be calculated - but still, it is highly counter-intuitive that such a coloring exists, and its rather difficult to find it when you do not know it already.
The awesomeness of Common Lisp gives a great opportunity to actually code it, using its included facilities of fractions:
(defun cantor-pair (n m)
(+ (* (+ n m) (+ n m 1) (/ 2)) m))
(defun z-to-n-0 (z)
(+ (* 2 (abs z)) (signum z)))
(defun rat-pair (q)
(cantor-pair (z-to-n-0 (numerator q)) (1+ (denominator q))))
(defun white-p (p q)
(< (rat-pair p) (rat-pair q)))
It uses Cantor's pairing function. I thought it'd be interesting to actually draw these points. Well, actually, it is not really interesting, anyway, here is the code that uses lispbuilder-sdl:
(sdl:with-init ()
(sdl:window 400 400)
(let ((zoom 100))
(flet ((draw-zoomed ()
(sdl:clear-display (sdl:color :r 0 :g 0 :b 0))
(dotimes (i 400)
(dotimes (j 400)
(when (white-p (/ i 400 zoom) (/ j 400 zoom))
(sdl:draw-pixel-* i j :color (sdl:color :r 255 :g 255 :b 255)))))
(sdl:update-display)))
(draw-zoomed)
(sdl:update-display)
(sdl:with-events ()
(:mouse-button-down-event
(:button btn)
(cond
((= btn sdl:mouse-wheel-up)
(incf zoom)
(draw-zoomed))
((= btn sdl:mouse-wheel-down)
(decf zoom)
(draw-zoomed))))
(:quit-event () t)))))
with the scroll-wheel you can change the interval that is shown (but be careful, if you scroll down 100 times, you get a division by zero, since the zoom will be 0 - as it was not that interesting I did not put that much effort into making it work). For everybody who does not want to do this, here is an image of some screenshot (I do not actually remember the zoom-factor):
It looks sort of nice when you scroll through it. The stripes are probably some boundaries of denominators.
[PS: For some reason, at the time of publishing this post, MathJax does not render the set-symbols correctly. I will probably investigate on this later. It should be clear anyway.]
Show comments (Requires JavaScript, loads external content and cookies from Disqus.com)